Immigration Stats: What the Numbers Show Under the Second Trump Administration
U.S. immigration has changed faster under the second Trump administration than in any comparable period in modern records. Since January 20, 2025, the administration has used executive orders, new funding, regulatory changes and diplomatic pressure to cut illegal crossings, expand interior enforcement and narrow several legal and humanitarian pathways. The numbers are large in both directions: some measures are at record highs, others near zero.
Supporters see a government finally enforcing laws that were on the books all along, after a Biden-era surge that brought more than 2 million border encounters in a single year. Critics see enforcement that has reached well past serious offenders and cut legal immigration the economy depends on. This piece lays out the data by category, with the administration's stated rationale and the main criticisms side by side.
The Border: Historic Lows in Crossings
The most watched immigration statistic, migrant apprehensions at the southern border, has fallen to levels not seen in half a century.
U.S. Customs and Border Protection recorded 237,538 migrant encounters at the U.S.-Mexico border in fiscal year 2025, the lowest total since 1970. That compares with about 1.53 million in FY2024 and 2.05 million in FY2023, an 84% decline year over year.
By December 2025, monthly apprehensions had fallen to 6,478, an 86% drop from December 2024. The Pew Research Center confirmed in early 2026 that encounters were at their lowest level in more than 50 years. DHS also reported that "gotaways" (people detected crossing but not caught) fell by roughly 90% compared with mid-2024.
The administration moved quickly:
- President Trump declared a national emergency at the southern border, activating military support for enforcement.
- The CBP One app, a Biden-era program for scheduling asylum appointments at ports of entry, was shut down. Monthly asylum-seeker entries through it fell from nearly 40,000 in December 2024 to 26 in February 2025.
- The "Remain in Mexico" policy (the Migrant Protection Protocols) was reinstated, requiring asylum seekers to wait in Mexico for their hearings.
- More than 94% of Border Patrol encounters from February through September 2025 ended in expedited removal, reinstatement of removal, voluntary return or transfer to ICE detention.
How the two sides read it. The administration argues that CBP One and parole programs functioned as an invitation, and that ending release into the interior removed the incentive to cross. Critics, including WOLA, attribute part of the drop to the near-elimination of humanitarian access for people with genuine asylum claims. Both effects are likely at work, and the data alone doesn't separate them.
The Military at the Border
The administration deployed thousands of active-duty troops to support CBP with barrier construction, surveillance and logistics, and resumed wall construction on sections paused under the Biden administration.
Interior Enforcement: Arrests, Detention, and Deportation

With the border largely closed to new crossings, enforcement shifted to the interior, where most of the estimated unauthorized population already lives.
ICE Arrest Surge
ICE arrests roughly quadrupled compared with the final year of the Biden administration, averaging about 1,200 per day, the highest since the Obama administration's peak enforcement years. ICE made roughly 220,000 arrests between January 20 and mid-October 2025. Including CBP and other federal agents, more than 595,000 noncitizens were arrested between January 20 and December 10, 2025.
Who Is Being Arrested? The Disputed Number
This is the most contested statistic in the debate, and the answer depends on what counts as "criminal."
- The administration's figure: DHS has said about 70% of ICE arrests involve people with criminal convictions or pending criminal charges in the United States. It argues that anyone in the country unlawfully is removable under federal law regardless of criminal history, and that sanctuary policies force ICE to make arrests in communities instead of taking custody at jails, which produces more "collateral" arrests.
- The critics' figure: The Cato Institute, using ICE data, found 65% of people taken by ICE had no criminal conviction, and only 5–7% had a violent conviction. TRAC found about 70% of people in ICE custody in mid-2026 had no conviction.
- Fact-checkers: PolitiFact and FactCheck.org found the share with either a conviction or a pending charge was closer to 52% of detainees, and that the non-criminal share rose as arrests increased.
"No conviction" does not mean "no crime." Entering the United States without inspection is itself a federal crime under 8 U.S.C. §1325, and re-entering after deportation is a felony under §1326. Most people who crossed illegally were simply never prosecuted for it, so they show up in the data as having "no criminal conviction" even though the entry itself was a criminal offense. The distinction matters for one group: people who arrived legally and overstayed a visa have committed a civil immigration violation, not a crime.
The rest of the gap is also definitional. Pending charges aren't convictions, and many are dropped. Critics use "non-criminal" to mean no conviction on record. The administration argues that everyone here unlawfully is removable under federal law and that illegal entrants have broken criminal law by definition. Whether enforcement should prioritize people with violent or serious records or apply to everyone present unlawfully is a policy question the numbers can't settle.
Detention Capacity
Average daily ICE detention reached roughly 60,000 by the end of FY2025, about double the final Biden year, and later set new records above 70,000. The administration says expanded capacity is required to hold people pending removal rather than releasing them, a practice it blames for low appearance rates at immigration hearings. Critics point to overcrowding, deaths in custody and cost.
Deportation Numbers
Removals rose sharply, though they fell short of the stated goal of one million formal removals per year:
- DHS reported more than 605,000 removals through late 2025.
- DHS estimated about 1.9 million additional self-deportations, and Secretary Kristi Noem said more than 2.5 million people in the country illegally had left when both are combined.
- ICE alone removed roughly 540,000 people by January 2026, the highest in about a decade.
The self-deportation estimate is DHS's own and is hard to verify independently. The Peterson Institute and others have argued that some reported population declines don't add up, while the Center for Immigration Studies finds the foreign-born population clearly lower than in January 2025, though perhaps by less than first estimated.
Third-Country Deportations
When home countries refused to accept their nationals, the administration sent some deportees to third countries. In one ten-day period in mid-2025, more than 100 deportees from Afghanistan, Cuba, Nicaragua and elsewhere were flown to eight African countries. The administration argues this is the only option when origin countries are uncooperative. Critics and several federal courts have questioned the due-process protections involved, and the practice is still being litigated.
Legal Immigration: Sharp Reductions
Legal immigration also fell, which has drawn criticism from business groups and some Republicans as well as Democrats.
Overall Approvals
USCIS approved 8.3 million applications in 2025, compared with 11.4 million in 2024, a 27% decrease across all benefit types. Green card approvals fell 16%. The State Department issued roughly 250,000 fewer visas in the first eight months of 2025 than in the same period of 2024, with the largest drops among applicants from India, China and the Philippines.
The administration attributes much of the slowdown to tighter vetting and fraud screening. Critics say the added requirements work as a de facto cut without any change in law.
Student Visas
F-1 student visa issuances fell 31% from 2024, and new international enrollment at U.S. universities fell 17% between fall 2024 and fall 2025. Issuances to Indian students dropped about 40%.
New F-1 rules could affect up to 1.5 million enrolled students and generate roughly 400,000 additional extension requests a year, by DHS's own estimate. The administration says the rules close loopholes that let students stay indefinitely and address overstays. Universities warn of lost tuition revenue and a weaker STEM research pipeline.
H-1B Skilled Worker Visas
H-1B issuances fell 52% year over year: from 115,164 in October 2024–February 2025 to 55,057 in the same period a year later. Non-immigrant visa issuances overall fell by about one million over five months.
This is an internal split within the Trump coalition. Tech-sector figures argue skilled visas keep U.S. companies competitive. Restrictionists argue the H-1B program lets employers replace American workers with cheaper labor and suppresses wages in tech jobs. Policy signals shifted throughout 2025 as a result.
Population Growth
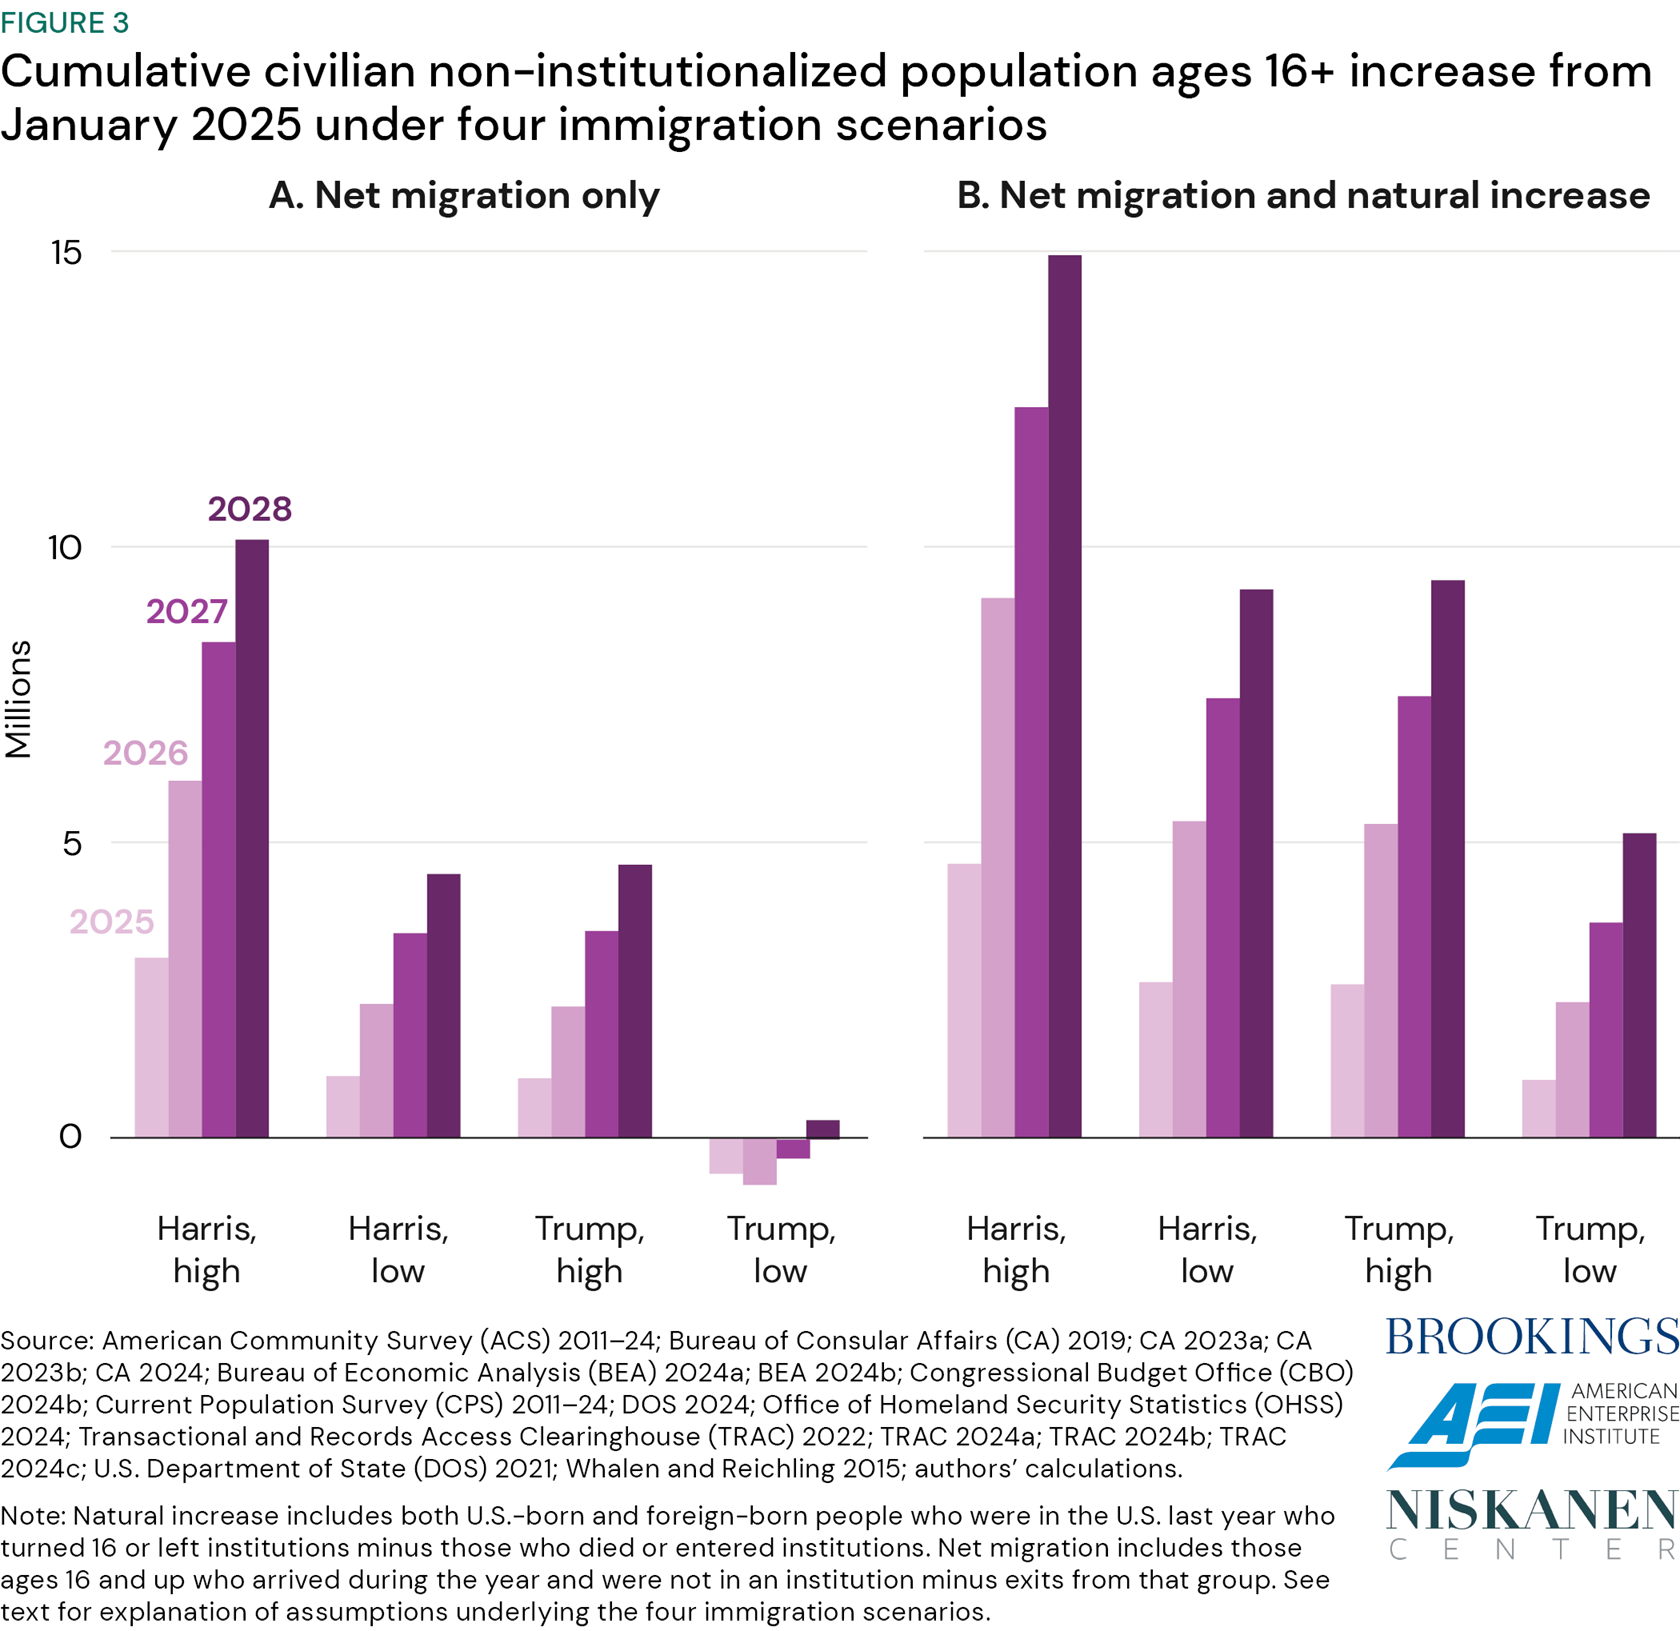
Immigration added about 1.3 million people to the U.S. population in 2025, down from 2.8 million in 2024. That affects labor force projections, Social Security modeling and housing demand, in both directions: fewer workers paying in, but also less pressure on housing costs and local services.
Travel-Ban Countries and Muslim-Majority Nations
One of the steepest declines is in admissions from countries covered by the expanded travel ban, many of which are Muslim-majority.
The Numbers
A Cato Institute analysis of State Department data found that visas and refugee admissions from 45 Muslim-majority countries fell from 21,096 in December 2024 to 808 in February 2026, a 96% reduction. Immigrant visas from those countries fell 95%, and refugee admissions from them fell from 5,157 to zero.
Afghanistan is the largest single contributor, accounting for 27% of the drop. Afghan admissions fell from 5,563 in December 2024 to 9 in February 2026, which has drawn criticism from veterans' groups because many Afghans applied under the Special Immigrant Visa program for those who assisted U.S. forces.
The Administration's Rationale
The June 2025 proclamation restricted entry from 19 countries (12 fully, 7 partially). It cited three criteria: inadequate vetting and information-sharing (10 countries), high visa overstay rates (15 countries) and refusal to take back deported nationals (8 countries). The list includes several non-Muslim-majority countries, including Haiti, Cuba, Venezuela, Burma and Laos. The Supreme Court upheld the first-term version of the ban on national-security grounds in 2018.
The Critics' View
Groups including the Brennan Center argue the criteria were applied inconsistently and that the effect falls overwhelmingly on Muslim-majority countries, echoing Trump's 2015 campaign proposal to ban Muslim immigration. Administration accounts have publicized the decline as a policy result. The data show the scale of the drop but can't establish intent, which is where the two sides disagree.
Other contributing policies:
- The suspension of the refugee program on January 20, 2025.
- Enhanced consular vetting, which slowed or halted processing for nationals of listed countries.
- The end of most humanitarian parole programs.
Refugee Admissions: Suspended, Then Capped
The U.S. refugee program, in place since 1980, was suspended on January 20, 2025, pending a review of vetting procedures and of whether communities could absorb new arrivals.
FY2026 Refugee Cap
For FY2026 the administration set a ceiling of 7,500, the lowest since the program began. The Biden administration's FY2025 cap was 125,000. Monthly admissions fell from 12,518 in December 2024 to 1,341 in March 2026.
A large share of the FY2026 slots went to Afrikaners from South Africa, whom the administration says face violence and discriminatory land and racial policies. Refugee organizations criticized the choice, noting that tens of thousands of Afghans, Congolese, Somalis and others remained in processing. The administration's position is that the refugee cap is set at presidential discretion and should reflect U.S. interests and capacity, not a fixed target.
Changes to Temporary Legal Status
Many of the people affected by status changes were in the country under programs designed to be temporary. Whether ending them is overdue housekeeping or a harmful reversal is a central point of dispute.
Temporary Protected Status
TPS protects nationals of countries hit by war or disaster from removal, for designated periods that can be renewed. Some designations have been renewed for decades (Honduras since 1999), which the administration argues has turned a temporary program into a permanent one Congress never authorized.
- Haiti: TPS terminated for about 353,000 people. DHS said conditions had improved enough for safe return.
- Venezuela: Two designations terminated, affecting an estimated 268,000–348,000 people. DHS said continued designation was contrary to the national interest.
- Afghanistan: TPS terminated for about 8,000 people.
Courts have pushed back in part. In January 2026 the Ninth Circuit ruled that Secretary Noem exceeded her authority by ending Venezuela's TPS before the prior extension expired, and litigation continues.
CHNV Parole
In March 2025, the administration revoked parole for about 530,000 people from Cuba, Haiti, Nicaragua and Venezuela who entered under the Biden-era CHNV program. The administration argued the statute allows parole only case by case for urgent humanitarian reasons or significant public benefit, and that the program used it as a categorical admissions channel. Supporters of CHNV note that participants had U.S. sponsors and passed security screening.
Cumulative Effect
Across parole terminations, TPS cancellations, visa revocations and asylum changes, more than 1.6 million people lost legal status in the first 11 months of the term. These were people who had been admitted lawfully, though mostly under statuses that were temporary by design. The Supreme Court has repeatedly been asked to rule on how far executive authority extends here.
Economic and Fiscal Effects: Contested Evidence
Economists disagree on the effects, and it's too early for definitive answers.
The Case for Costs
- Agriculture, construction, healthcare and hospitality report tighter labor supply.
- Tech employers report longer vacancies for high-skill roles, and Canada, Germany and the U.K. report more skilled-visa applications from people who previously targeted the U.S.
- Universities report tuition shortfalls from lower international enrollment, and some smaller schools warn of financial stress.
- The Migration Policy Institute projects sharply slower population growth, which affects Social Security and Medicare financing ratios and congressional apportionment.
The Case for Benefits
- Native employment: The Center for Immigration Studies found employed U.S.-born workers up 412,000 from January 2025 to February 2026 while employed immigrants fell 606,000, with gains concentrated among prime-age U.S.-born men without a college degree. CIS itself cautions the survey data are noisy, and critics, including the Washington Monthly and the Center for American Progress, dispute that native employment has meaningfully risen.
- Wages: Restrictionist economists argue that reduced low-skill labor supply raises wages for the lowest-paid American workers, who compete most directly with new arrivals.
- Public costs: Cities such as New York, Chicago and Denver spent billions on migrant shelter and services during the 2022–2024 surge. Those pressures have largely eased with the drop in arrivals.
- Border security: Fewer crossings and gotaways mean fewer unvetted entries and less business for smuggling cartels.
Enforcement Funding: The One Big Beautiful Bill
The main legislative vehicle was the One Big Beautiful Bill, the budget reconciliation law passed in summer 2025. Its immigration provisions included:
- $45 billion for detention construction and operation.
- $30 billion for ICE hiring, transportation and facilities.
- $30 billion for border barrier construction.
- Enough to give ICE a larger officer corps than the FBI.
Total new enforcement funding was about $170 billion, plus roughly $70 billion more in June 2026. Supporters argue this is what it costs to enforce existing law against an unauthorized population estimated in the millions, after years of underfunding. The left-leaning Economic Policy Institute noted that enforcement would receive 80 times the funding of labor standards enforcement, which it framed as misplaced priorities.
Benchmarking: Trump 1.0 vs. Trump 2.0
| Metric | Trump 1st Term (4 Years) | Trump 2nd Term (First ~18 Months) |
|---|---|---|
| Annual deportations (peak) | ~266,000 (FY2019) | ~540,000+ (ICE alone by Jan 2026) |
| Border encounters (low) | ~396,000 (FY2020) | ~237,538 (FY2025) |
| Refugee cap | 18,000 (FY2020) | 7,500 (FY2026) |
| Travel-ban / Muslim-majority admissions | Reduced ~50% | Reduced ~96% |
| ICE detention (peak daily) | ~55,000 (FY2019) | ~60,000–73,000 (2025–26) |
| Arrests with no U.S. conviction on record (share)* | Minority of arrests | ~52–65%, depending on source and definition |
*Excludes the uncharged offense of illegal entry itself (8 U.S.C. §1325), which most unlawful entrants committed but were never prosecuted for.
The second term has moved faster and more broadly than the first, on both illegal and legal immigration.
Political and International Dimensions
Domestic Reception
The administration presents the numbers as promises kept: a secured border, record removals and an end to programs it considers unlawful. Immigration remained a top voter concern in 2025 polling, with Republican voters broadly supportive of the enforcement approach.
Critics, including Democratic officials, immigration attorneys, civil liberties groups and some business-aligned Republicans, point to arrests of people with no criminal convictions, the loss of legal pathways and damage to specific industries. Public opinion has been split: support for border security stayed high while support for some interior tactics has been more mixed.
International Relations
Countries that refused deportees faced U.S. visa restrictions on their officials, and some recipients of third-country deportations lodged formal protests. Mexico's cooperation, receiving returnees and hosting asylum seekers awaiting U.S. hearings, has been central to the drop in border crossings.
Conclusion
The data show a restructuring of the U.S. immigration system across every channel at once. Border crossings are at 50-year lows. Removals are at a decade high, and DHS reports far more voluntary departures. Legal immigration approvals are down 27%, refugee admissions are at a historic minimum, admissions from travel-ban countries are down about 96%, and more than 1.6 million people have lost temporary legal status.
What those numbers mean depends on the question being asked. Supporters see the government enforcing existing law, restoring control of the border and ending temporary programs that had drifted into permanence, after a surge they regard as a failure of the previous administration. They also note that illegal entry is itself a federal crime, even when it was never prosecuted. Critics see enforcement that reaches far past people with serious criminal records, humanitarian commitments abandoned and a legal immigration cut that will cost the economy over time. Several of the biggest questions, including who is being arrested, how many people left voluntarily and what the labor-market effects will be, are still disputed in the data itself. The scale of the change is not.
Sources:
- 8 U.S.C. §1325 — Improper entry by alien — Cornell Legal Information Institute
- 8 U.S.C. §1326 — Reentry of removed aliens — Cornell Legal Information Institute
- Legal Immigration from Majority-Muslim Nations Was Cut 96% Since 2024 — Cato Institute
- 65 Percent of People Taken by ICE Had No Convictions, 93 Percent No Violent Convictions — Cato Institute
- Trump Has Cut Legal Immigration More Than Illegal Immigration — Cato Institute
- DHS Removes More than Half a Million Illegal Aliens From US — DHS
- Thanks to President Trump and Secretary Noem, More than 2.5 Million Illegal Aliens Left the U.S. — DHS
- DHS Shatters Nationwide Border Records — DHS
- ICE Arrests Worst of the Worst — DHS
- Restricting the Entry of Foreign Nationals (June 2025 Proclamation) — The White House
- Presidential Proclamation of June 4, 2025 — Congressional Research Service
- Do 70% of immigrant detainees have criminal convictions or charges? — PolitiFact
- As ICE Arrests Increased, a Higher Portion Had No U.S. Criminal Record — FactCheck.org
- Has Immigration Enforcement Benefitted American Workers? — Center for Immigration Studies
- Immigrant Population Down, but Maybe Less than We Thought — Center for Immigration Studies
- No, Native-Born Employment Has Not Soared — Washington Monthly
- Reported multi-million decline in US immigrants just doesn't add up — PIIE
- National TPS Alliance v. Noem — Ninth Circuit opinion
- Unleashing Power in New Ways: Immigration in the First Year of Trump 2.0 — Migration Policy Institute
- Migrant encounters at US-Mexico border at lowest level in over 50 years — Pew Research Center
- Weekly U.S.-Mexico Border Update: 2025 migration data — WOLA
- New ICE Arrest Statistics Shed Light on Who the Agency is Targeting — American Immigration Council
- The Deportation Industrial Complex: Arrests and Detentions by the Numbers — Brennan Center
- Trump's Entry Bans Aren't Really About National Security — Brennan Center
- Refugee Cap to be Set at Record Low 7,500 in FY 2026 — Global Refuge
- ICE's detainee population reaches new record high of 73,000 — CBS News
- Trump revokes legal status for 530,000 immigrants in the US — Al Jazeera
- ICE deports Afghans and others to Africa — CBS News
- House Republican budget bill gives Trump $185 billion for mass deportation agenda — EPI
- Trump Restrictions on Legal Immigration Could Sharply Reduce U.S. Population Growth — Migration Policy Institute
- How the Trump administration is eroding the immigrant talent pipeline — Brookings Institution